Original research · measured, not copied · open data
The Same Container, Seven Sources, 3,250 kg of Disagreement

Published payload figures for an ordinary 20 ft container range from 25,000 kg to 28,250 kg — a spread of 3,250 kg, more than three tonnes, across seven sources that search engines and AI assistants read every day. A 40 ft high cube spans 26,000–29,000 kg, and one widely-cited page prints high-cube dimensions under the heading “40 ft standard”. Some variation is real: containers differ by manufacturer and build year. What nobody had published is how large the disagreement is. The full comparison is below and downloadable as JSON or CSV.
Ask any assistant what a 40 ft container carries and you get a hedge — “approximately”, “typically around”, “depending on the carrier”. That hedge is not caution. It is what happens when a model reads five sources and finds five different numbers with no way to reconcile them.
We went and measured the disagreement. Every figure below was read from the publisher’s own page, recorded verbatim with its URL and the date we read it, and left uncorrected — including ours, which sits in the table as one row among the rest.

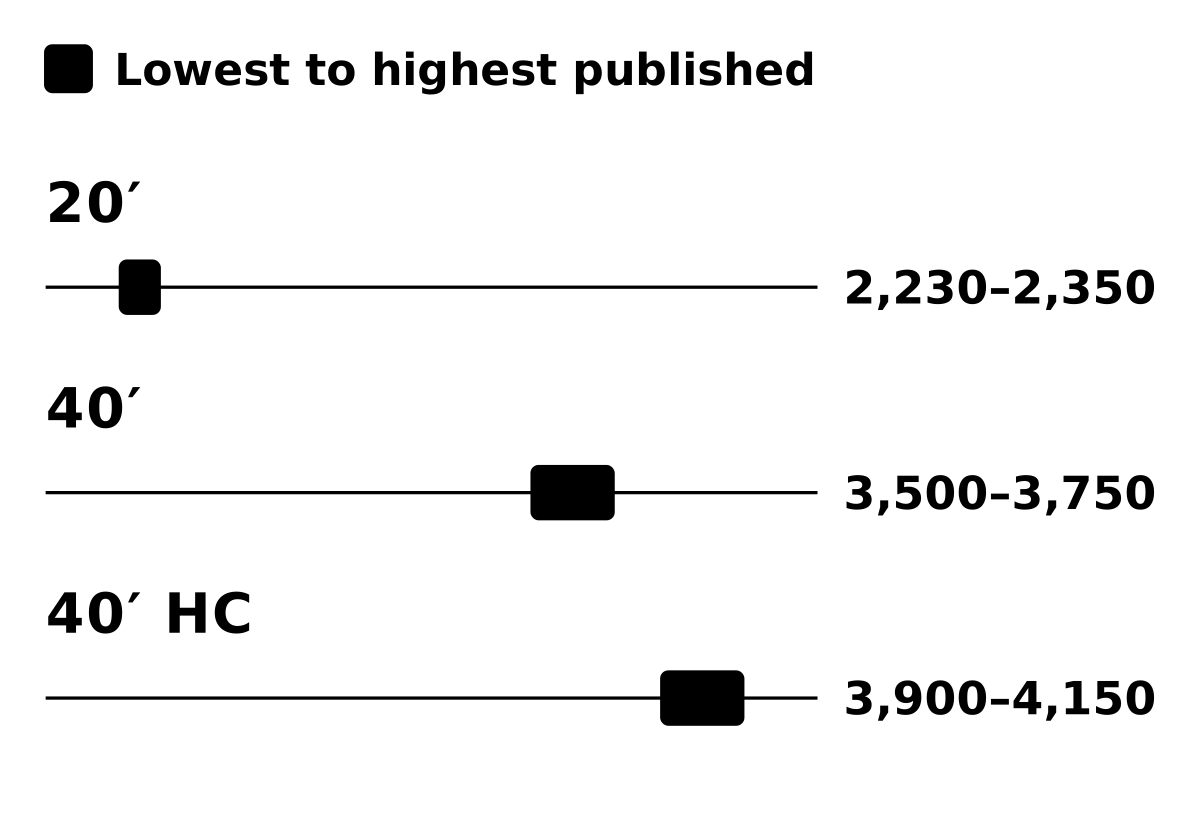
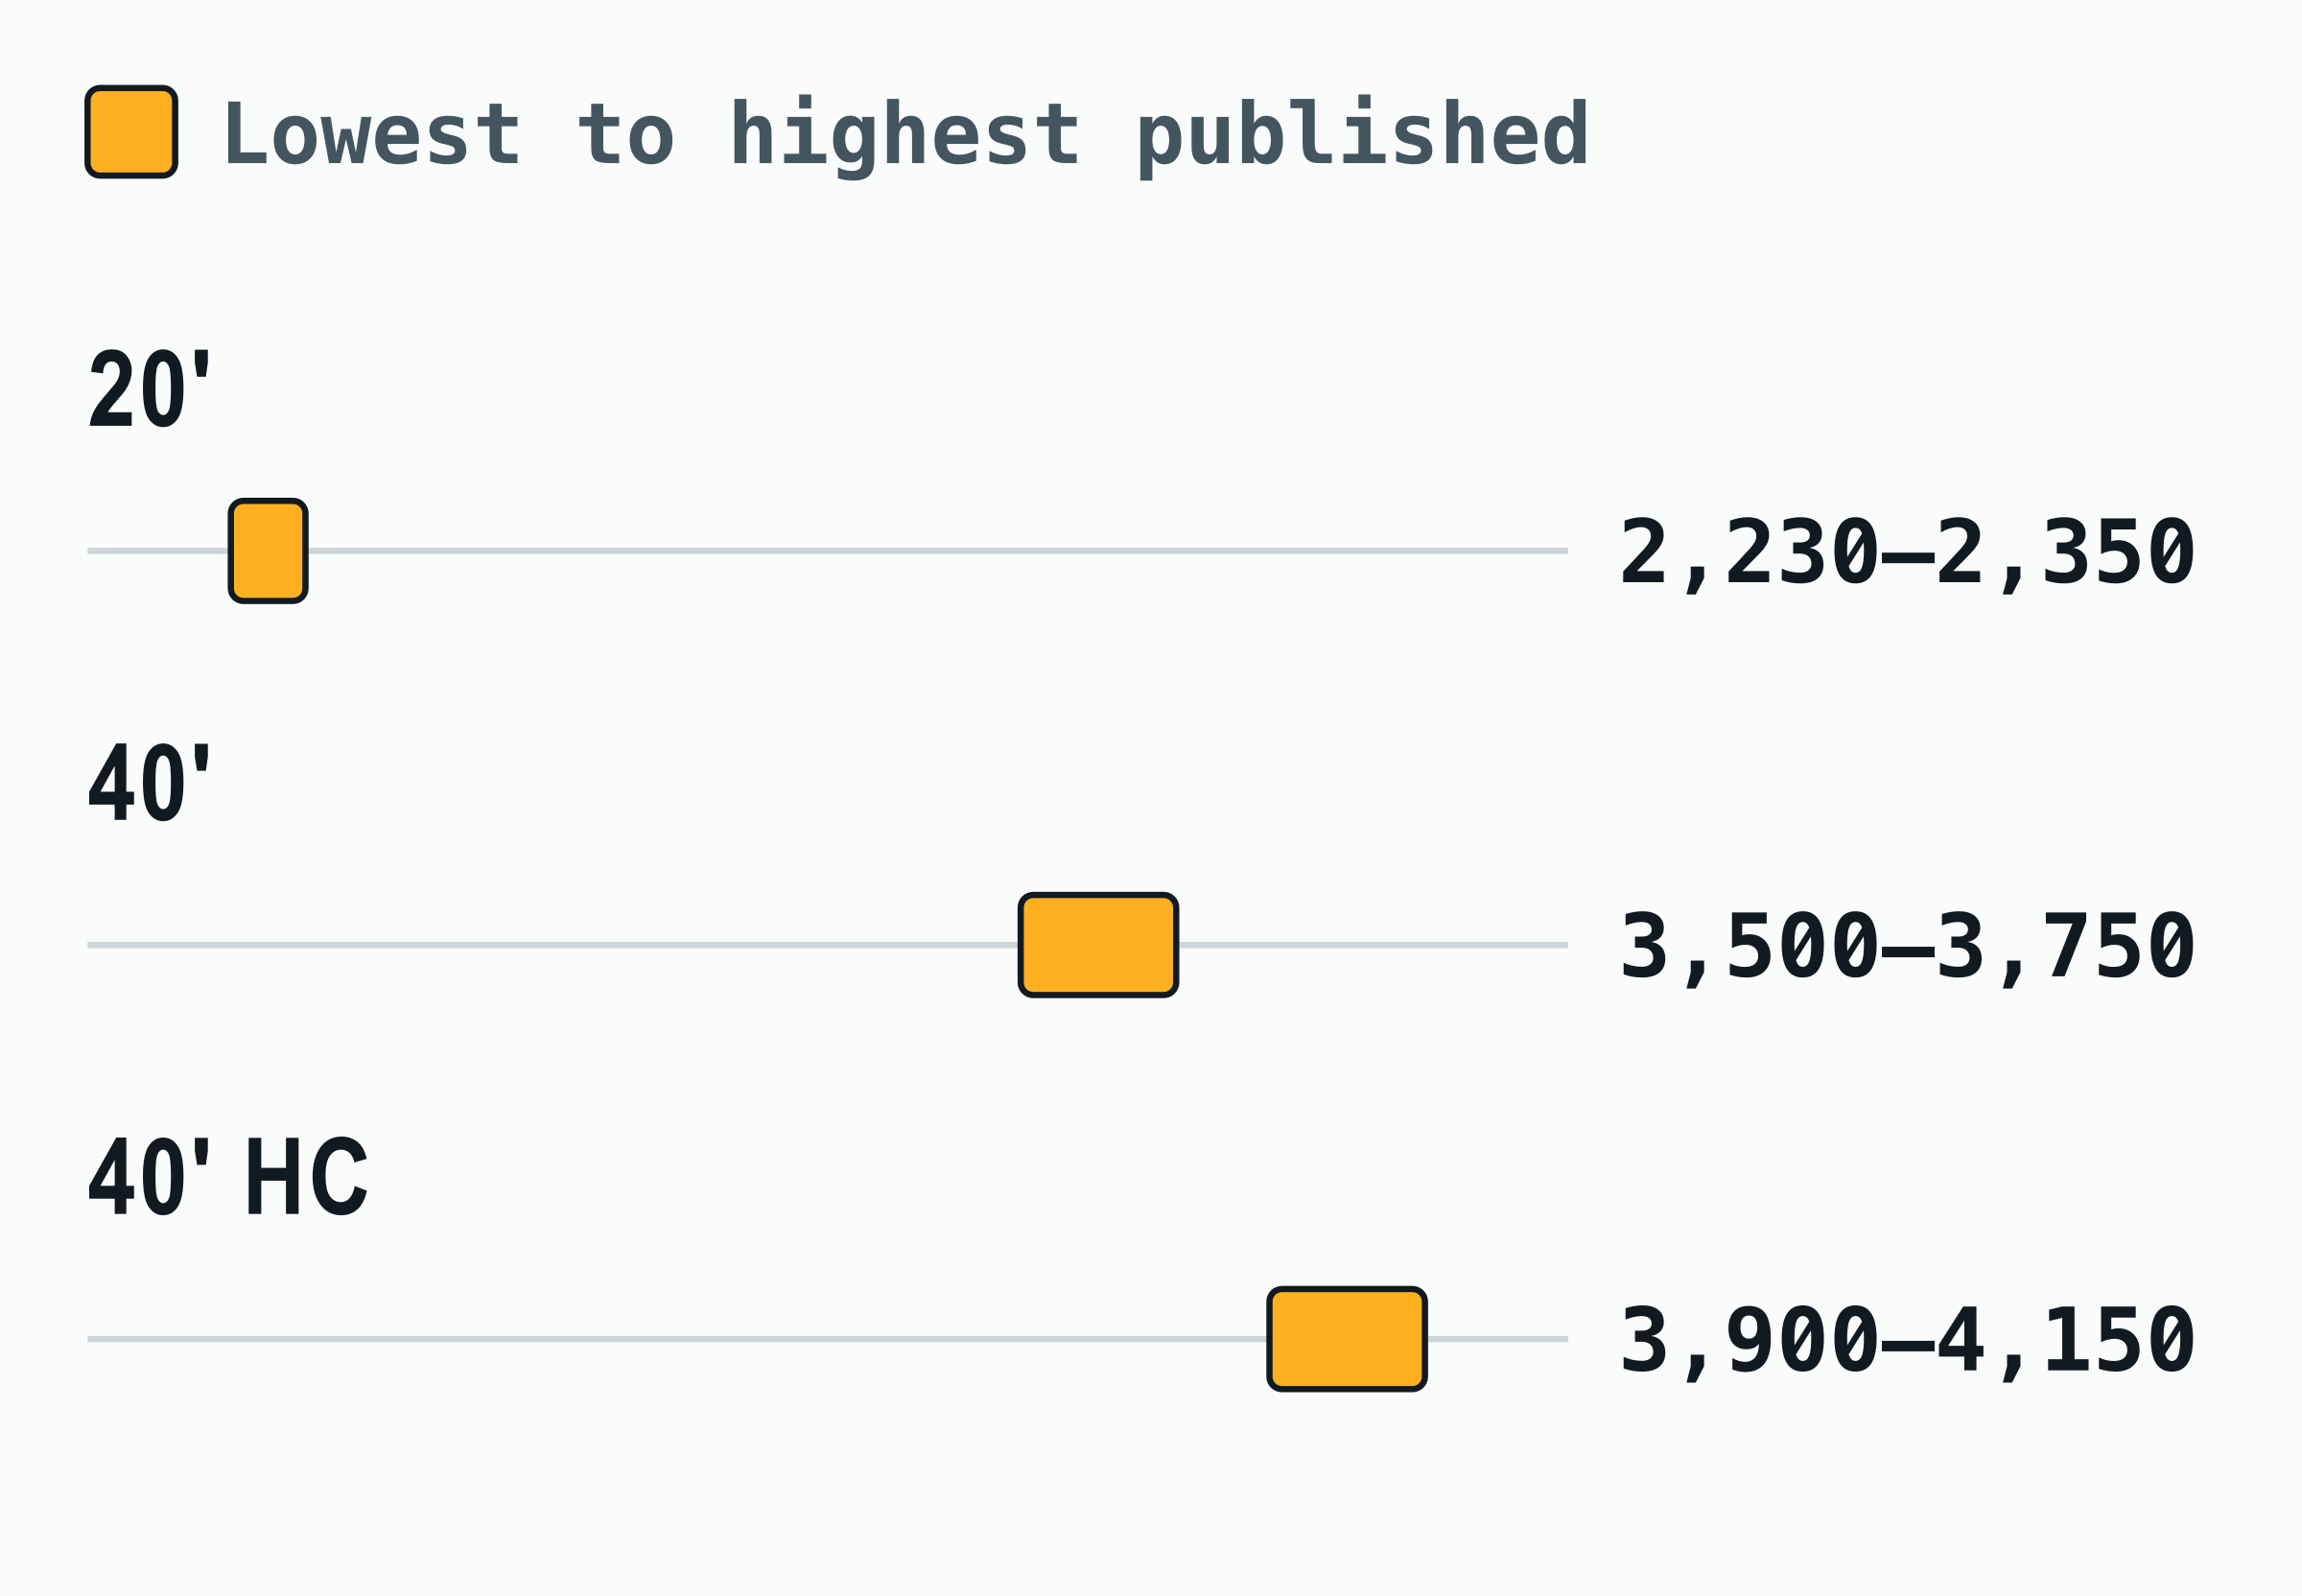
The numbers in this chart
| Container | Lowest | Highest | Spread |
|---|---|---|---|
| 20 ft container | 2,230 kg | 2,350 kg | 120 kg |
| 40 ft container | 3,500 kg | 3,750 kg | 250 kg |
| 40 ft high cube container | 3,900 kg | 4,150 kg | 250 kg |

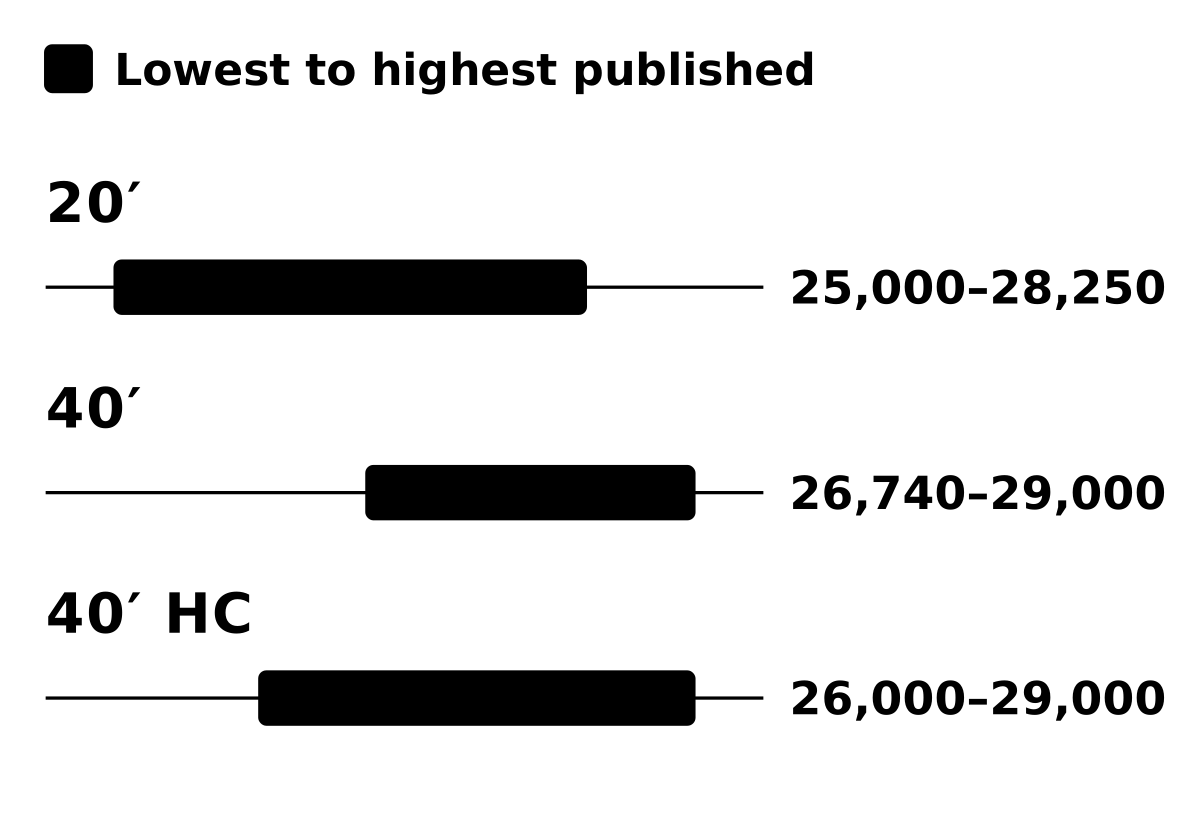
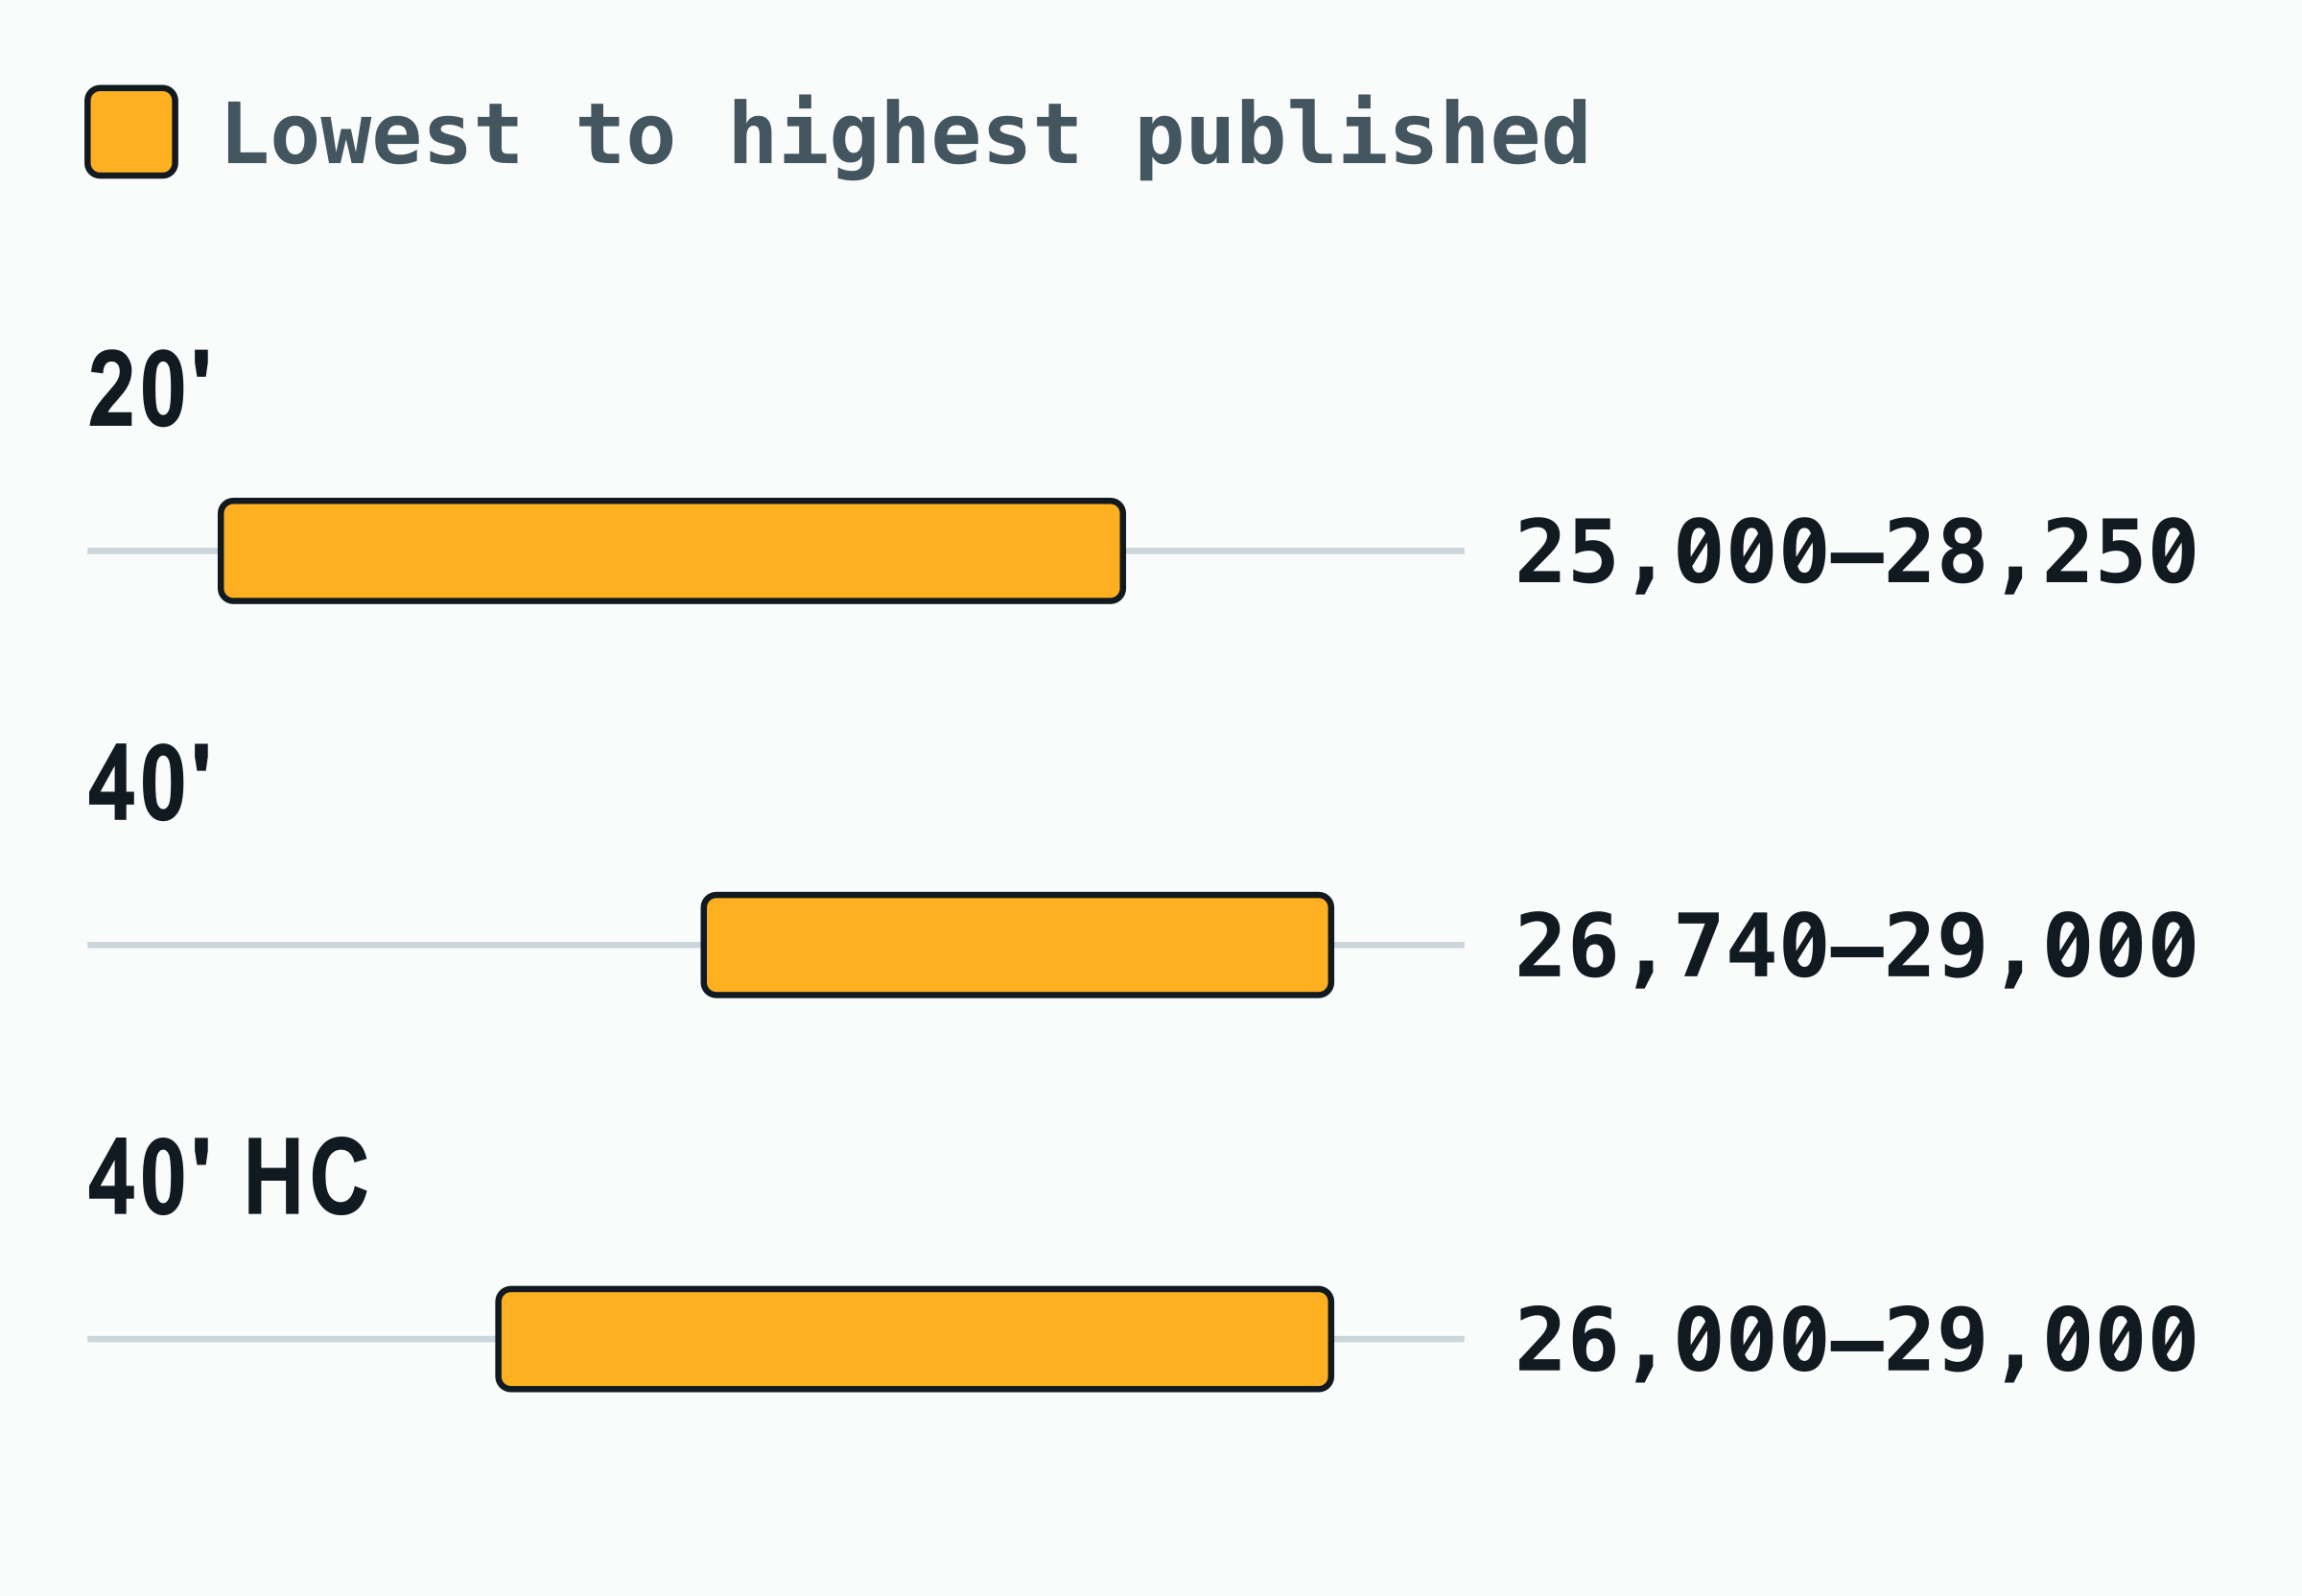
The numbers in this chart
| Container | Lowest | Highest | Spread |
|---|---|---|---|
| 20 ft container | 25,000 kg | 28,250 kg | 3,250 kg |
| 40 ft container | 26,740 kg | 29,000 kg | 2,260 kg |
| 40 ft high cube container | 26,000 kg | 29,000 kg | 3,000 kg |
Method: what we compared and what we did not
We took the sources that actually get read: the pages that rank on the first page for container dimension queries, and the pages that Google’s AI Overview and ChatGPT cite when asked. For each we recorded internal dimensions, tare weight, payload and cubic capacity exactly as published, converting units but never rounding to make a figure fit.
Where a publisher gives a range we kept both bounds. Where a figure contradicts something else on the same page, we recorded the figure and noted the contradiction rather than choosing which half to believe.
Two things we deliberately did not do. We did not rank sources by quality — this is a measurement of spread, not a league table. And we did not treat our own figures as the answer: contsize appears as one source among seven, and the spread is computed with our number inside it, not against it.
Carrier specification sheets from Maersk and Hapag-Lloyd were not machine-readable at the time of collection — both refuse automated requests — so this first edition compares the secondary sources that the search and AI layer actually consumes. Adding carrier primaries is the next edition.
The results: every figure, every source
Read the spread column first. Dimensional figures agree closely — internal height of a 40 ft high cube spans just 10 mm across five sources, which is ordinary manufacturing variation and nothing to worry about.
Weights are a different story. Payload is the number that decides whether your cargo is legal, and it is the number sources disagree about most: 3,250 kg on a 20 ft box, 3,000 kg on a 40 ft high cube. Anyone planning a load from the wrong row is three tonnes out before they start.
| Container | Specification | Source | Published | Spread |
|---|---|---|---|---|
| 40 ft dry | Capacity | DSV | 67.7 m³ | 16 m³ |
| FreightTotals | 67.7 m³ | |||
| Logisber ⓘ | 60–67 m³ | |||
| iContainers ⓘ | 76 m³ | |||
| ContSize | 67.7 m³ | |||
| 20 ft dry | Payload | DSV | 25,000 kg | 3,250 kg |
| FreightTotals | 28,130 kg | |||
| ContSize | 28,250 kg | |||
| 40 ft high cube | Payload | FreightTotals | 28,600 kg | 3,000 kg |
| Oceanbox Containers | 26,460 kg | |||
| ContainerMath | 26,500 kg | |||
| iContainers ⓘ | 26,000–29,000 kg | |||
| ContSize | 28,600 kg | |||
| 40 ft dry | Payload | DSV | 27,600 kg | 2,260 kg |
| FreightTotals | 28,750 kg | |||
| Logisber ⓘ | 29,000 kg | |||
| ContSize | 26,740 kg | |||
| 40 ft dry | Tare weight | DSV | 3,750 kg | 250 kg |
| FreightTotals | 3,750 kg | |||
| Logisber ⓘ | 3,500–3,750 kg | |||
| ContSize | 3,740 kg | |||
| 40 ft high cube | Tare weight | FreightTotals | 3,900 kg | 250 kg |
| Oceanbox Containers | 4,020 kg | |||
| iContainers ⓘ | 4,150 kg | |||
| ContSize | 3,900 kg | |||
| 20 ft dry | Tare weight | DSV | 2,300 kg | 120 kg |
| FreightTotals | 2,350 kg | |||
| ContSize | 2,230 kg | |||
| 40 ft high cube | Capacity | FreightTotals | 76.3 m³ | 0.36 m³ |
| Oceanbox Containers | 76.04 m³ | |||
| ContSize | 76.4 m³ | |||
| 40 ft high cube | Internal height | FreightTotals | 2,700 mm | 10 mm |
| Oceanbox Containers | 2,690 mm | |||
| ContainerMath | 2,700 mm | |||
| iContainers | 2,690 mm | |||
| ContSize | 2,698 mm | |||
| 40 ft dry | Internal length | DSV | 12,030 mm | 32 mm |
| FreightTotals | 12,032 mm | |||
| Logisber | 12,000 mm | |||
| ContSize | 12,032 mm | |||
| 20 ft dry | Internal height | FreightTotals | 2,395 mm | 2 mm |
| ContSize | 2,393 mm | |||
| 20 ft dry | Capacity | DSV | 33.2 m³ | 0 m³ |
| FreightTotals | 33.2 m³ | |||
| ContSize | 33.2 m³ |
Figures read from each publisher's own page on 2026-09-16 and recorded verbatim. A spread is not an error rate — real containers vary by manufacturer and build year. What had never been published is how large the disagreement is.
Why payload disagrees so much
Three mechanisms explain almost all of it. The first is honest: payload equals max gross minus tare, and tare genuinely varies by manufacturer and build year, so a 150 kg difference in tare moves payload by the same amount. That accounts for the small spreads.
The second is a ratings mix-up. Most boxes are plated for a max gross of 30,480 kg, but heavy-tested ones are rated to 32,500 kg — and ISO 668 has allowed up to 36,000 kg since 2016, so the rating is the manufacturer’s choice, not a single figure in the standard. Quote a 32,500 kg rating against a standard tare and you publish a payload that looks generous by two tonnes and is not available on most equipment. One source in our table states “up to 32 tonnes with carrier approval”, which exceeds 30,480 kg once tare is added back.
The third is simple copying. A figure enters one popular page, gets quoted by the next site without a source, and by the tenth repetition nobody can trace where it came from. That is how a 25,000 kg payload for a 20 ft container — over three tonnes below the ISO arithmetic — ends up on a global freight forwarder’s own site.
The high cube mix-up, named
One pattern deserves its own paragraph because it is the most consequential error we found. A 40 ft standard container holds 67.7 m³ and stands 2,591 mm tall externally; a 40 ft high cube holds about 76 m³ and stands 2,896 mm. They are different boxes that cost different money.
One page in our comparison — ranked on the first page in Mexico and cited by Google’s AI Overview for Spanish dimension queries — publishes 2.90 m external height, 2.69 m internal height and roughly 76 m³ under the heading “contenedor de 40 pies” with no high-cube qualifier. Those are high-cube figures. A reader planning around them will book the wrong equipment, and an assistant summarising that page will repeat the mistake.
We are not naming this to score a point. We are naming it because the error is currently propagating into AI answers, and the only way that stops is if somebody writes down what the correct split is and shows their working.
What to do with a spread
If you are planning a load, the operative number is not on any website: it is on the CSC plate bolted to your specific container, which carries that unit’s real tare and max gross. Every figure published anywhere — ours included — is a typical value for a class of equipment.
If you need a planning figure before the box arrives, use the ISO arithmetic rather than a quoted payload: max gross 30,480 kg for standard ratings, minus the tare band for that type, and leave margin. Our per-type figures are in the container weight guide.
And if you are writing about containers, cite the standard and the date. Half the spread in this table exists because somebody published a number without saying where it came from.
Open data and corrections
The comparison is published as an open dataset — spec-variance.json and spec-variance.csv — free to reuse with attribution. Each row carries the publisher, the figure, the page it came from and the date it was read, so the measurement can be repeated or contradicted.
If we have misread your page, or you have corrected a figure since we read it, tell us and we will re-read and re-publish with a new date. Our method is on how we verify data, and corrections are logged on the about page.
Frequently asked questions
How much do published container payload figures differ?
By up to 3,250 kg for a 20 ft container — published figures run from 25,000 kg to 28,250 kg across the seven sources we compared, and a 40 ft high cube spans 26,000–29,000 kg.
What is the payload of a 20 ft container?
About 28,250 kg on the usual rating: most 20 ft boxes are plated for a max gross of 30,480 kg and a typical tare is 2,230 kg. Sources publishing 25,000 kg are roughly three tonnes below that arithmetic, which is why the figure on your CSC plate is the one that counts.
Why do container dimension sources disagree?
Three reasons: genuine manufacturing variation in tare weight, confusion between the 30,480 kg standard rating and the 32,500 kg heavy-tested rating, and uncited copying between sites. The first is legitimate; the other two are avoidable.
Is a 40 ft container 67.7 or 76 cubic metres?
67.7 m³ for a standard 40 ft and about 76 m³ for a 40 ft high cube — they are different containers. Pages that publish 76 m³ under a plain “40 ft” heading are quoting high-cube figures without saying so.
Which container spec source should I trust?
For your actual shipment, the CSC plate on that container — it carries that unit’s real tare and max gross. Every published table, this site included, gives typical values for a class of equipment rather than for your box.
Can I reuse this dataset?
Yes — it is free to reuse with attribution to contsize.com, as JSON and CSV, with every figure carrying its source URL and read date so you can verify or challenge it.